Debug
Using the debugger
The debug pane combines a program-level view, a CPU-level instruction trace, and a trace capture tool for analyzing the emulator's behavior in detail.
Overview
The debug pane has three tabs: CALCULATOR, CPU, and LOG.
- CALCULATOR — Program listing (copied from RAM), registers, flags, and HIR values at the current moment. Shows the instruction that will execute next. Useful for stepping through your own programs.
- CPU — Execution trace: the actual sequence of ROM instructions that ran. Shows the instruction that just finished and the register state after it executed. You can scroll back through the history.
- LOG — Raw debug output, SCOM register inspection, and the TRACE toggle. Most useful for capturing session files for deep analysis.
CALCULATOR tab
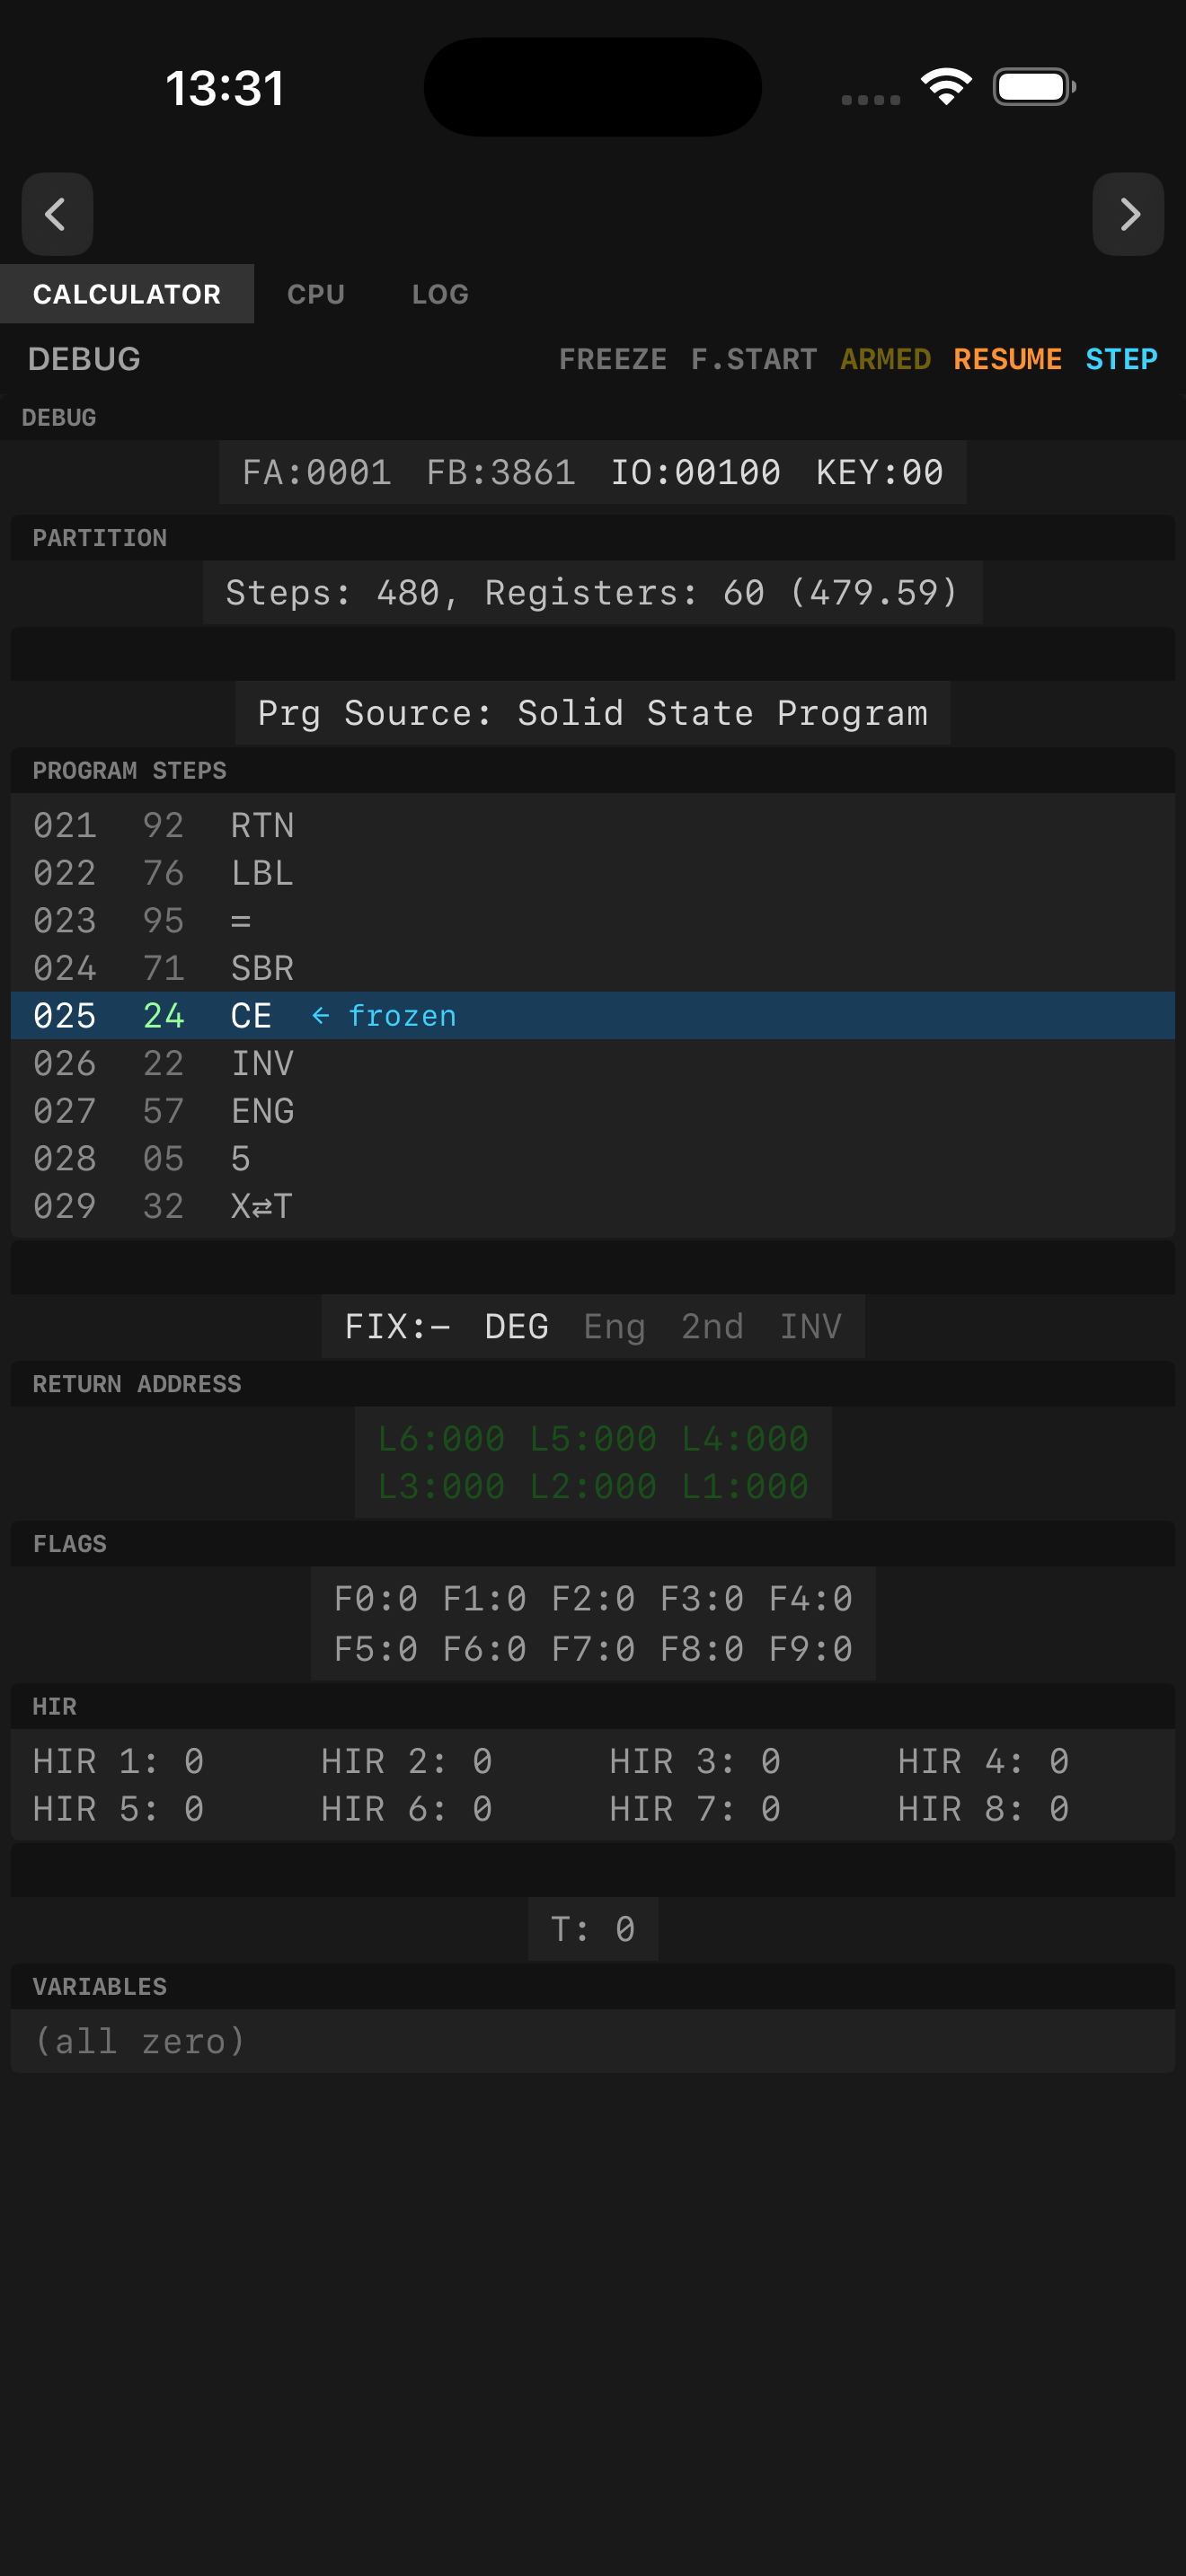
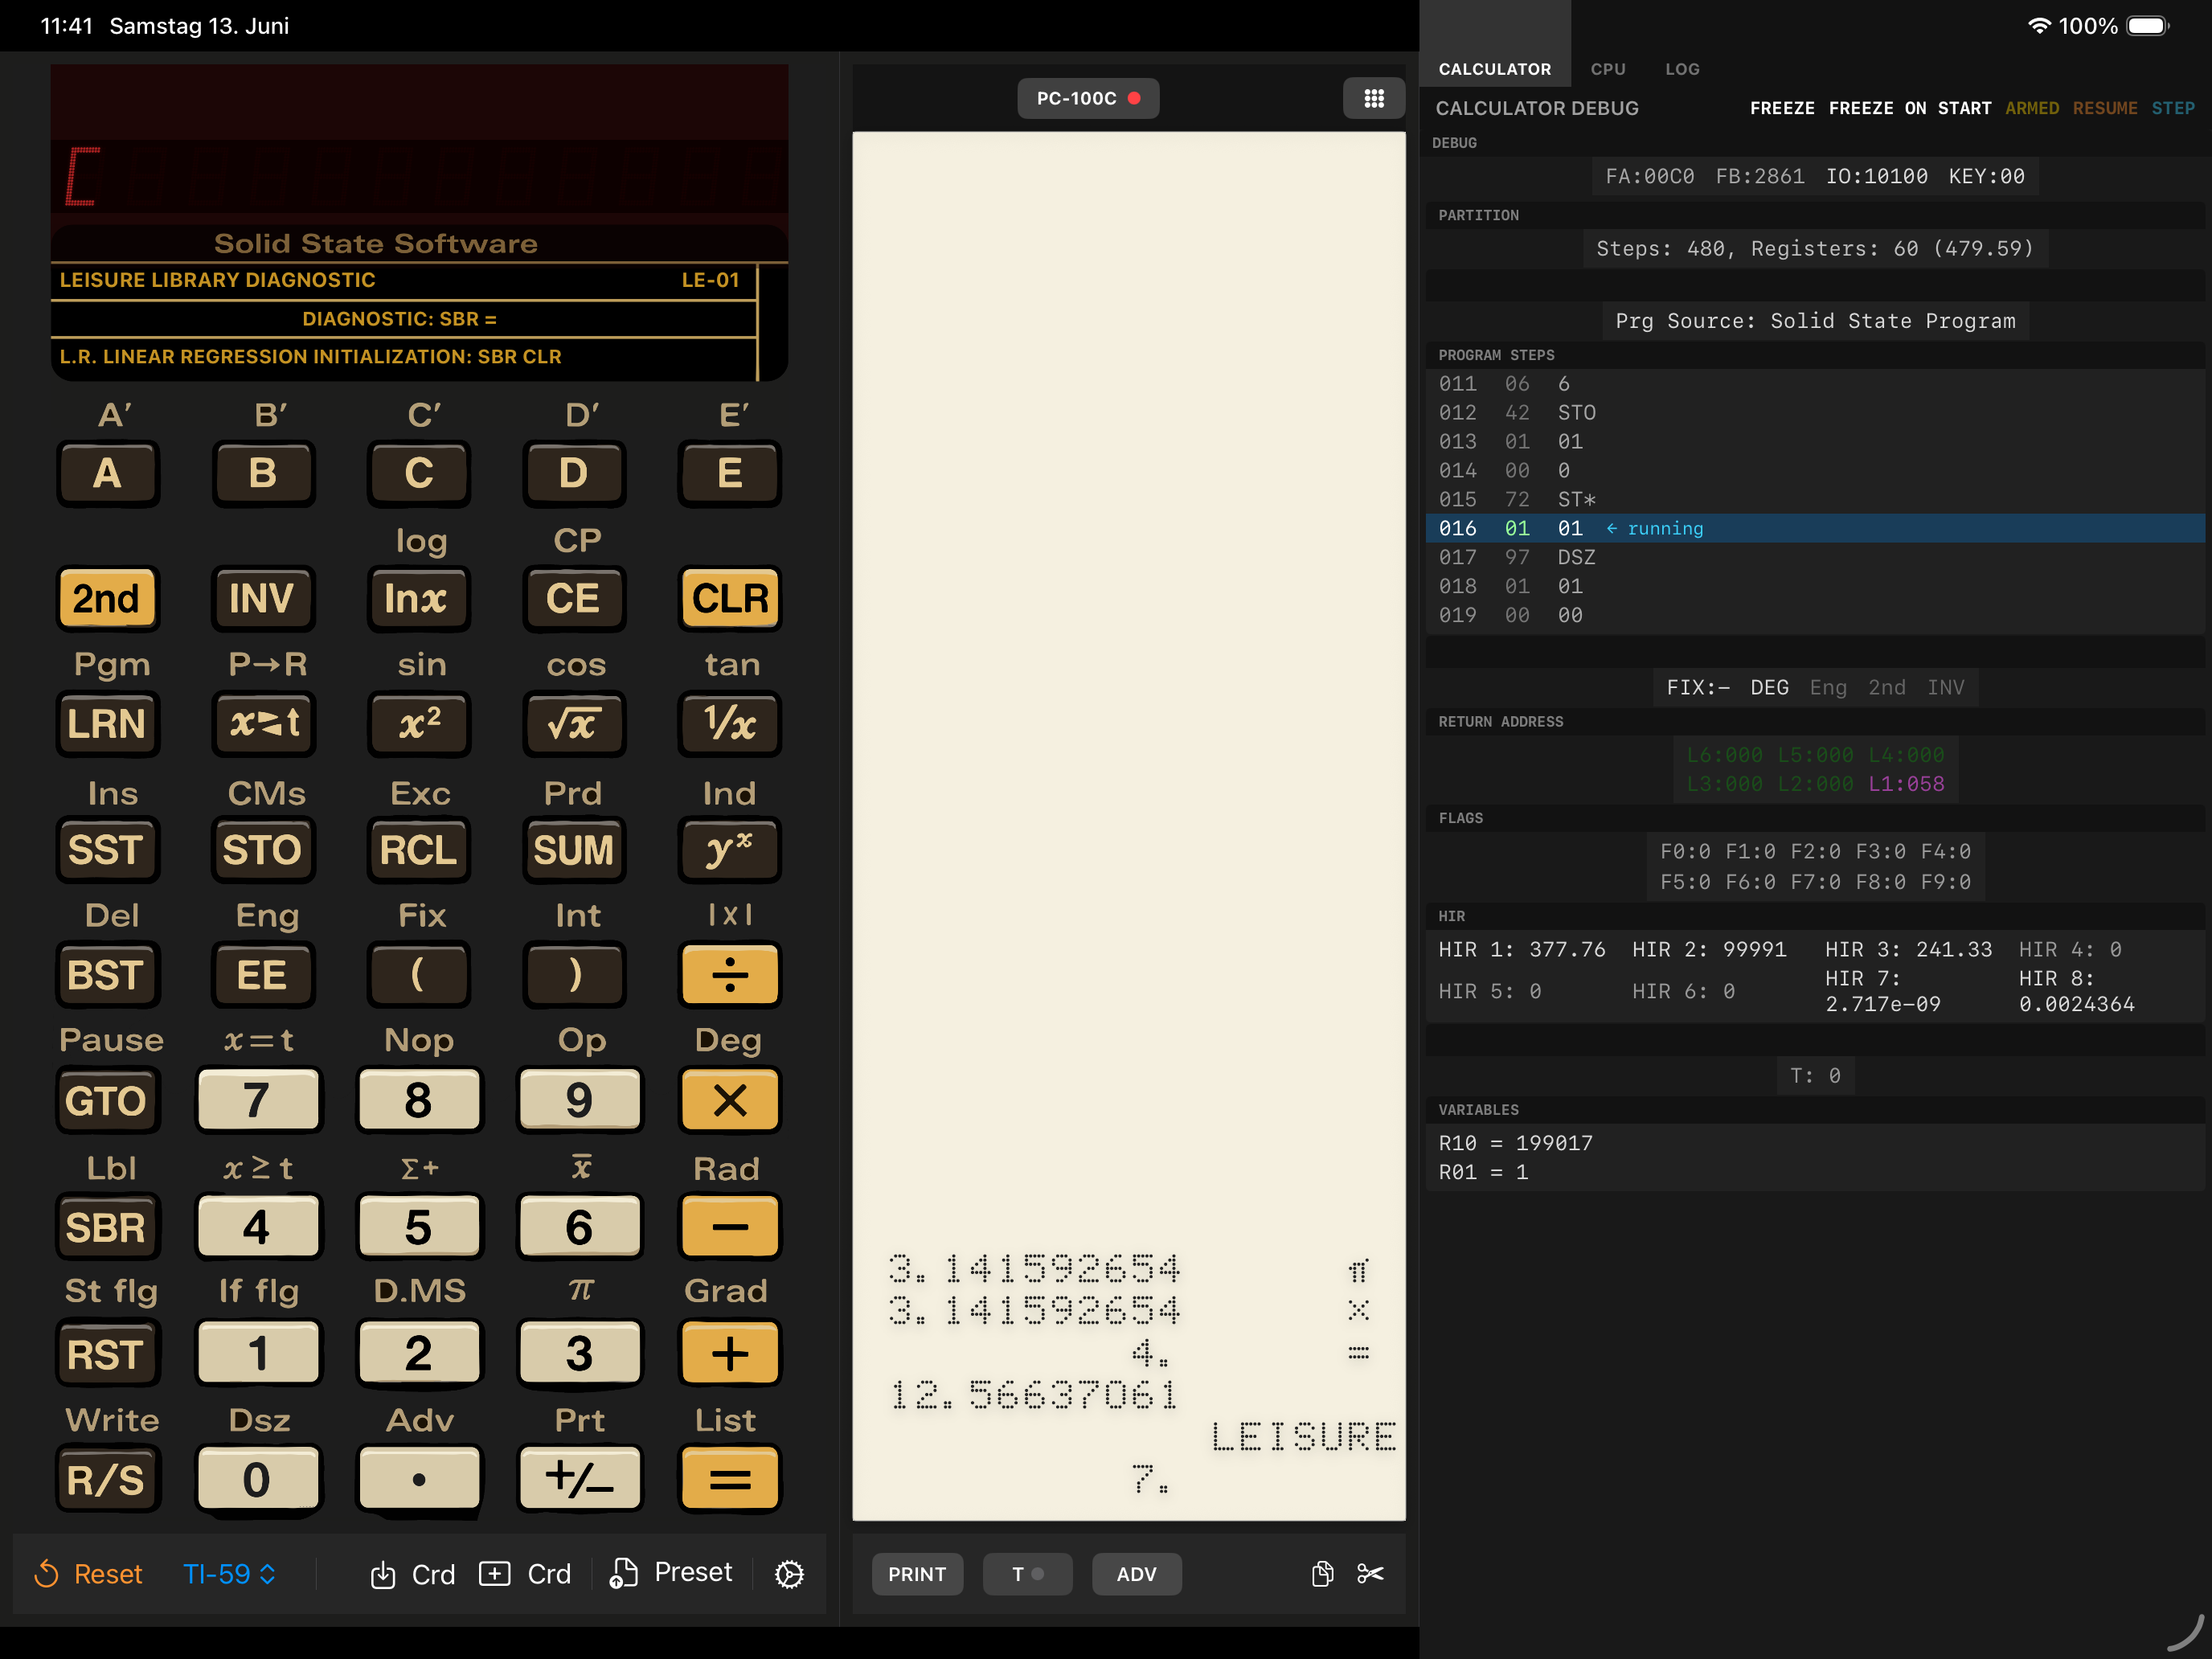
The CALCULATOR tab shows a window into program memory (copied from RAM) centred on the current step. The highlighted instruction is the one that will execute next. After a jump (GTO, SBR, etc.) the listing jumps to the new location — it does not show where you came from, because it is not a trace.
Registers and flags reflect the calculator state right now, before the highlighted instruction runs.
STEP in CALCULATOR mode — pressing Step runs the CPU until the program counter changes (i.e. until the next user-visible step advances), then freezes again. This is the right tool for tracing through a keystroke-driven program one step at a time.
CPU tab
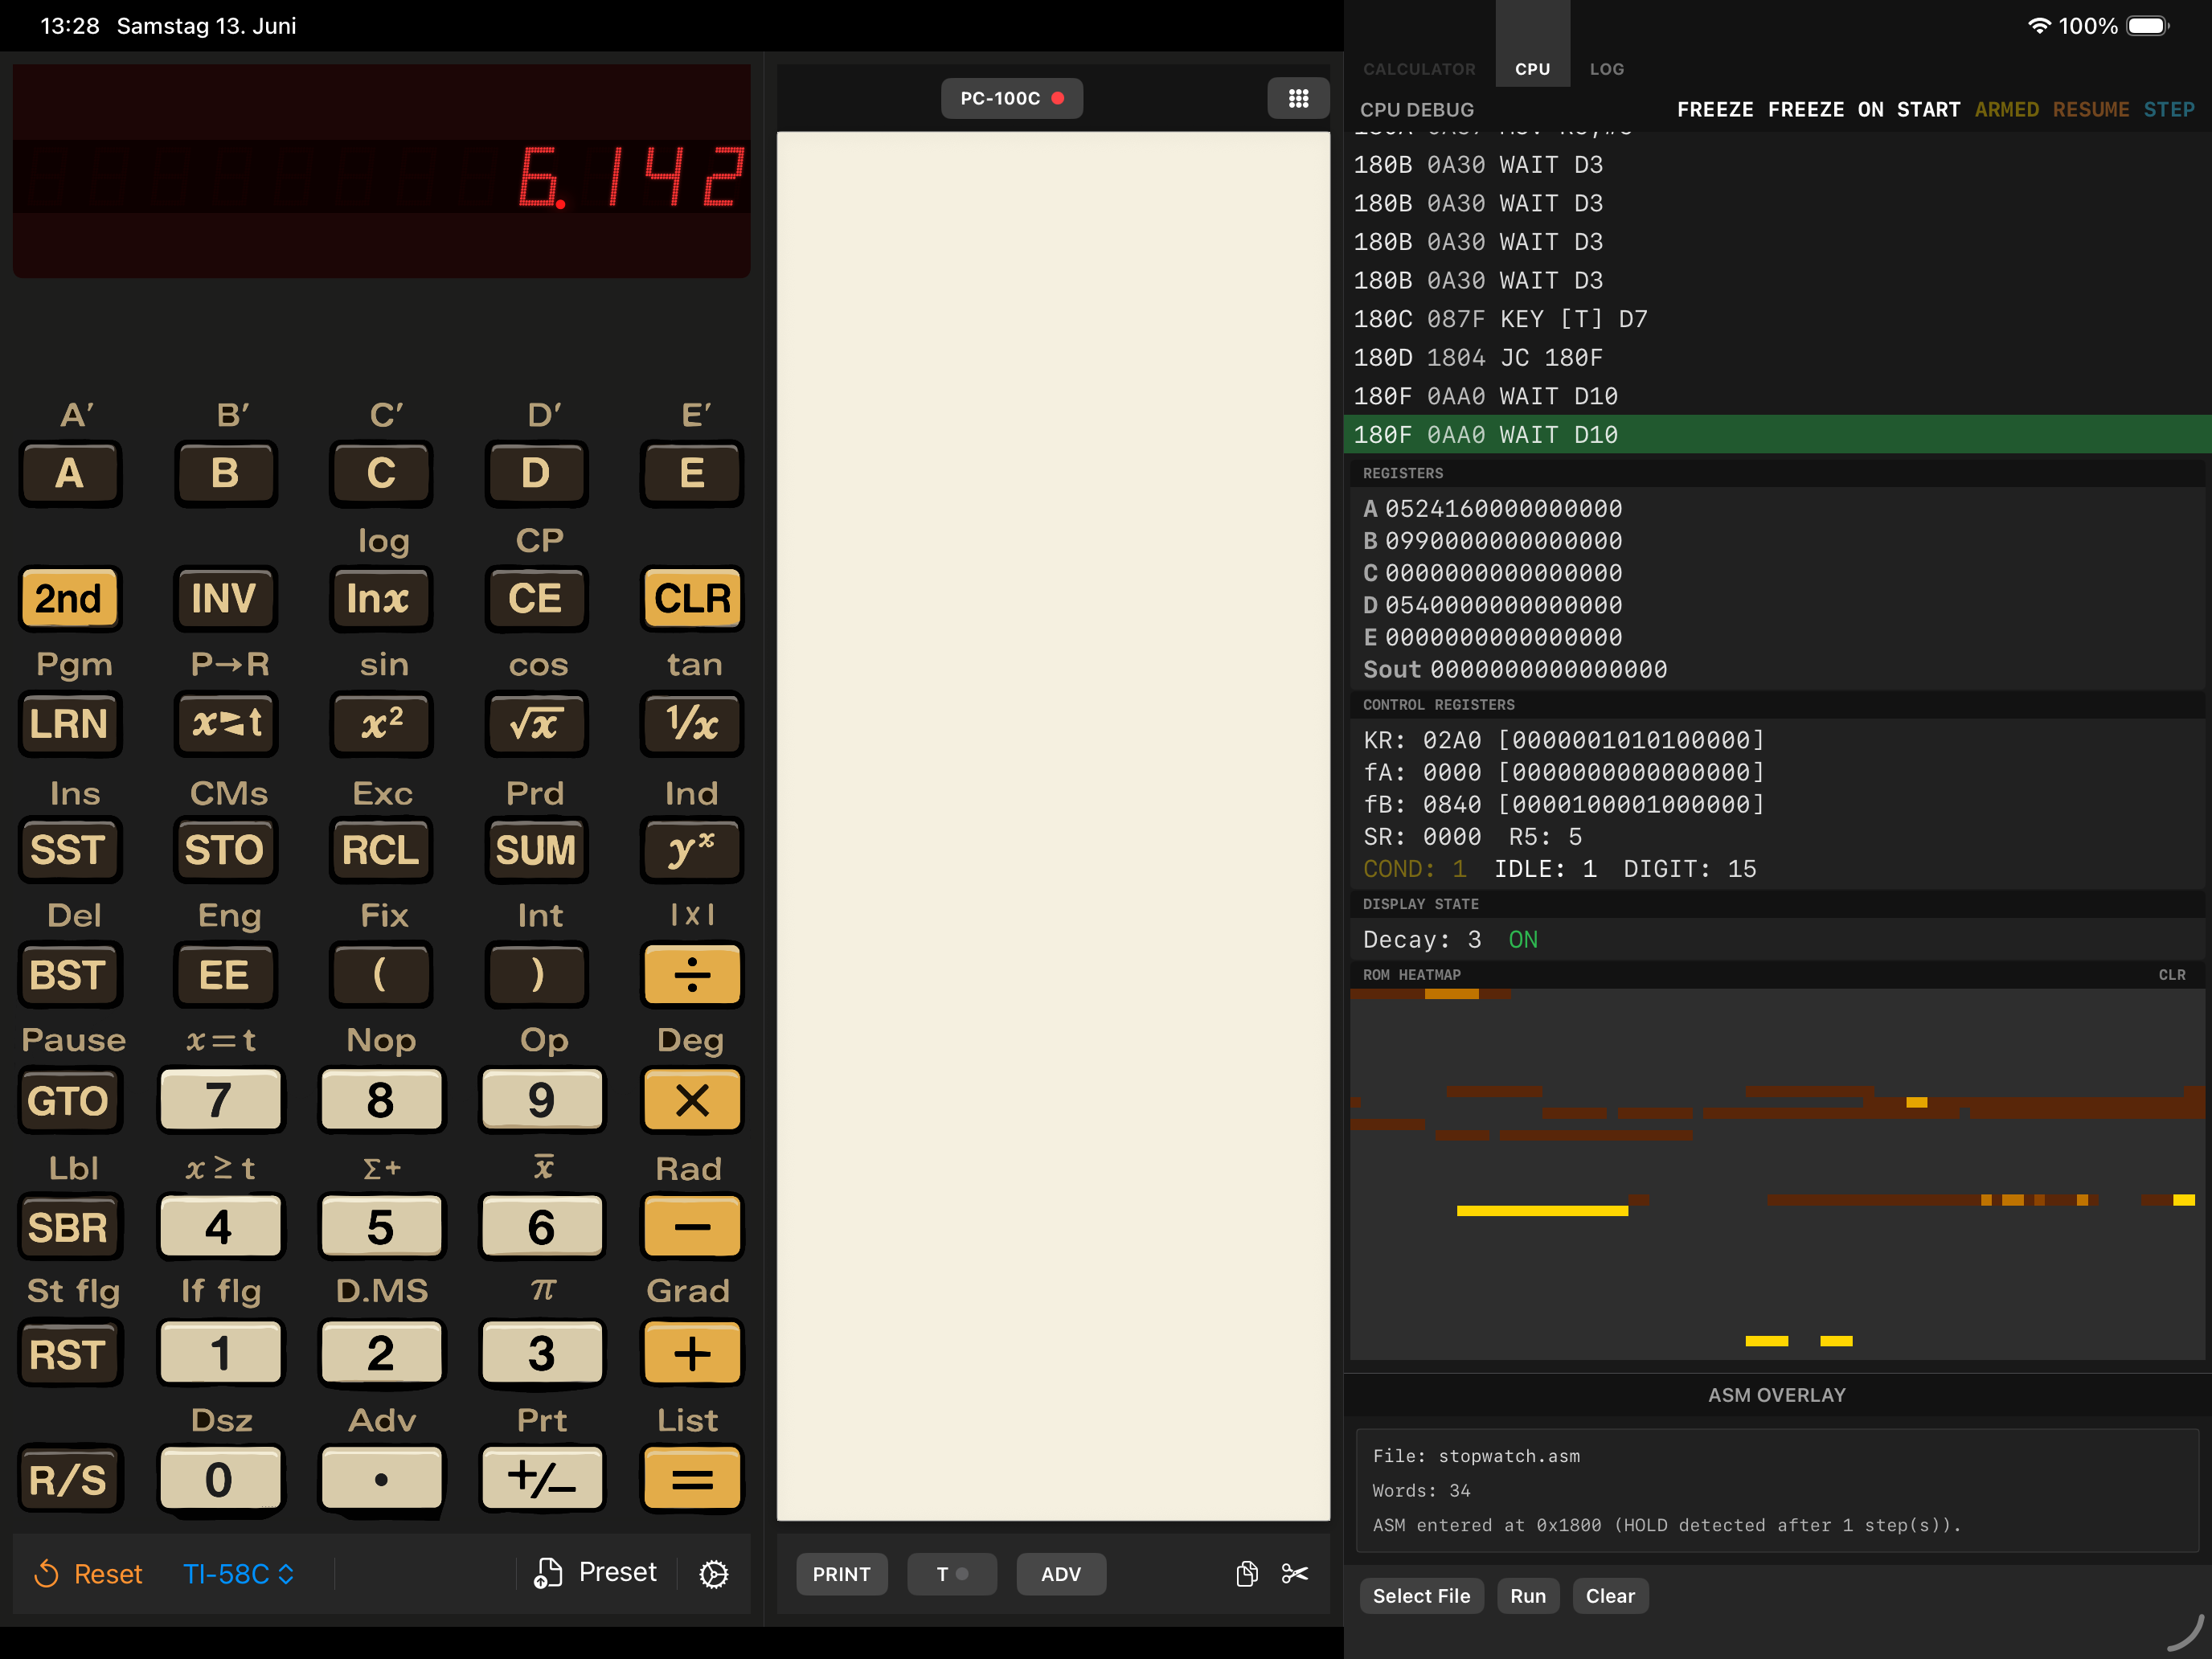
The CPU tab shows the actual ROM instructions that executed, in order. Each entry represents an instruction that already ran; registers and flags are in the state after that instruction completed.
Because it is a true execution trace, you can see jumps, subroutine calls, and PREG transitions — the address changes visibly in the listing. You can also scroll back through past entries to review earlier execution.
STEP in CPU mode — pressing Step executes exactly one ROM instruction, then freezes. This is the right tool when you want to follow the ROM's internal logic one opcode at a time.
Note on TEST/JUMP flags: because state is captured after each instruction, a TEST shows the flag it set, but the following JUMP shows the auto-restored condition (usually 1). This is expected behaviour — it is not a bug.
Freeze controls
The toolbar above the debug pane offers FREEZE, F.START (Freeze on Start), ARMED, RESUME, and STEP.
- FREEZE — stops the CPU immediately.
- F.START (CALCULATOR tab) — arms the debugger so it freezes the first time the calculator-level program counter changes. This is triggered by pressing R/S, launching a program via a label, or any similar action. Useful for catching the very start of a program run.
- F.START (CPU tab) — arms the debugger so it freezes the moment the calculator leaves the keyboard scan loop. This happens when you press any key (which causes the ROM to exit the idle loop and start processing the keystroke) or when the calculator is reset. Useful for catching the very first ROM instruction of a key-press handler.
- ARMED — shown in yellow when F.START is active; click it to cancel.
- RESUME — resumes execution from the frozen state.
- STEP — advances one step (semantics differ per tab, see above).
Only one F.START arm can be active at a time. Pressing F.START in one tab while the other is already ARMED silently transfers the arm. Once frozen, RESUME and STEP are only available in the tab that caused the freeze — the other tab's buttons are disabled to prevent accidental cross-tab interactions.
iPhone behaviour
On iPhone, the debugger panel is full-screen and covers the calculator. This is different from iPad and Mac, where both views are visible at the same time.
- Switching to the CPU tab resets the heat map, because the CPU trace was not running while CALCULATOR was visible. Exception: if the CPU is already frozen when you switch, the heat map is preserved.
- The selected tab (CALCULATOR, CPU, LOG) is remembered when you navigate away from the debugger and return.
- F.START in CALCULATOR works best in landscape or on iPad/Mac, where you can press a key on the calculator while the tab is watching. On iPhone you would need to go back to the calculator, press the key, then return to the debugger.
- F.START in CPU arms in the background and fires as soon as you press any key (or reset the calculator), regardless of which tab or screen is visible — the freeze is waiting for a ROM-level scan-loop exit, not a screen interaction.
TRACE and LOG: for session capture and analysis
The LOG panel serves two main purposes:
- Raw SCOM inspection — Shows the low-level scratch memory that the ROM uses. The CALCULATOR view displays decoded SCOM values (like HIR section), but LOG shows the raw hex.
- TRACE toggle — Records a binary session file while the calculator is running. This is the most thorough way to understand sequences like the reset routine or key-processing flow.
To capture and analyze a sequence:
- Switch to the LOG tab and toggle TRACE on.
- Perform the action you want to analyze (e.g., press Reset, or execute a ROM subroutine).
- Toggle TRACE off to stop recording.
- Export the trace file (use the Files app on iOS to email it, or find it on Mac).
- On a computer with Python, download the
read_trace.pytool from the Calc-U-59 tools folder. - Run:
python3 ./read_trace.py --clean --skip-repeating CALCU59_TRACE.bin > CALCU59_TRACE.txt - Open the resulting text file to see the full execution trace as human-readable disassembly.
The binary trace file can be large (190 MB for a long session), but the text output is much smaller (57 kB) because the tool deduplicates repetitive loops — especially the keyboard scan loop that runs continuously. This makes it practical to analyze even long traces.
When to use each tool
- CALCULATOR tab — Stepping through your own program one step at a time, checking registers and flags at each step.
- CPU tab — Tracing the ROM's internal instruction flow, reviewing jumps and subroutine calls, scrolling back through execution history.
- TRACE (in LOG) — Capturing a complete ROM sequence for offline analysis (reset routine, memory writes, keyboard processing, etc.).
- Debug logging (in LOG) — Low or High level logging is mainly used by the developer for debugging specific issues. When enabled, you will see all memory writes and other hardware events. This has limited utility for regular app users.
CALCULATOR tab — iPhone
CALCULATOR tab — iPad
CPU tab — iPad